Lab Values That Indicate Dehydration: Blood and Urine Patterns


Clinicians often see a high blood urea nitrogen (BUN), a rising creatinine, or concentrated urine interpreted as evidence of dehydration. Each finding can support that interpretation in the appropriate clinical setting, but each also has common alternative explanations. No single blood or urine value confirms a fluid deficit by itself.
Part of the problem is terminology. In routine charting, dehydration may refer to free-water loss, salt-and-water loss, reduced kidney perfusion, or a rising creatinine that needs a kidney-injury evaluation. These states overlap, but they do not produce identical laboratory patterns.
This article reviews the serum and urine patterns seen with water-loss dehydration, extracellular volume depletion, prerenal azotemia, and intrinsic kidney injury. It also reviews commonly used threshold ranges, confounders, misleading patterns, escalation triggers, and documentation language for describing laboratory findings with appropriate certainty.
Ready to start delivering better patient care?
Join 125,000 healthcare providers who rely on Fullscript to dispense top-quality supplements and labs to their patients.
Why dehydration is a pattern, not a single laboratory value
Laboratory findings differ depending on whether the main issue is free-water loss, salt-and-water loss, reduced kidney perfusion, or intrinsic kidney injury. Serum sodium mainly describes tonicity. Serum osmolality reflects total solute concentration, which tracks with tonicity when urea and other permeable solutes are not markedly elevated. BUN, creatinine, urine sodium, urine osmolality, and urine sediment help describe perfusion and kidney response.
Separating water-loss dehydration, volume depletion, and prerenal azotemia
Water-loss dehydration is primarily an intracellular, hypertonic free-water deficit. When water loss exceeds sodium loss, the extracellular fluid becomes hyperosmolar, and serum sodium often rises. Serum sodium and serum osmolality are therefore generally more informative for this state than BUN or urine sodium alone. The terms dehydration and volume depletion describe different physiology, and using them interchangeably is a recognized source of confusion at the bedside. (1)
Extracellular volume depletion is loss of sodium and water from the extracellular fluid space. It can follow vomiting, diarrhea, sweating, diuretic exposure, bleeding, burns, poor intake, and renal or adrenal disorders. In this setting, kidney perfusion and renal sodium handling become more relevant than tonicity alone, so the BUN-to-creatinine ratio, urine sodium, and urine osmolality may provide supportive information, although each is nonspecific. (1)
Prerenal azotemia is reduced kidney perfusion. It can result from true extracellular volume depletion or from low effective arterial blood volume, in which arterial tissues are underperfused despite normal or increased total-body fluid. A prerenal pattern commonly includes a rising BUN, rising creatinine, elevated BUN-to-creatinine ratio, low urine sodium, and concentrated urine. If reduced perfusion is severe or sustained, prerenal physiology can progress to intrinsic kidney injury, including acute tubular necrosis. (1)
These distinctions affect interpretation. A normal serum sodium does not exclude isotonic salt-and-water loss. A prerenal pattern does not prove free-water dehydration. The same BUN, creatinine, and urine sodium pattern can lead to different fluid and monitoring decisions depending on whether the patient has gastrointestinal losses, diuretic exposure, heart failure, cirrhosis, or evolving intrinsic kidney injury. (1)
Why clinical context controls laboratory interpretation
History and examination give laboratory findings their clinical setting. Intake and output, recent illness, exertion, heat exposure, gastrointestinal losses, orthostatic symptoms, hypotension, tachycardia, mucous membranes, mental status, and urine output all change how much weight a laboratory pattern carries. Laboratory data are one part of that assessment, not a substitute for it. (1)
Medications and comorbidities can change otherwise familiar patterns. Diuretics, renin-angiotensin system (RAS) agents, nonsteroidal anti-inflammatory drugs (NSAIDs), and sodium-glucose cotransporter 2 (SGLT2) inhibitors affect volume status, renal perfusion, or sodium handling. Combined diuretic, RAS-inhibitor, and NSAID exposure has been associated with a higher risk of acute kidney injuryl particularly in settings of hypovolemia and impaired glomerular perfusion. (3) Chronic kidney disease, heart failure, liver disease, adrenal disease, and diabetes mellitus also shift baseline values and change the interpretation of borderline results.
A borderline value carries more weight when the history and examination already suggest a fluid deficit. The same BUN-to-creatinine ratio has different meaning in a vomiting patient with poor intake than in a well-appearing patient with stable vital signs. Early deficits, mixed losses, and recent oral or intravenous fluids may leave some values within the reference range.
Serum osmolality is the most objective serum marker for the water-loss axis. In older-adult populations, calculated and measured osmolarity have been studied as screens for water-loss dehydration. (8) Osmolality is less informative when sodium and water are lost together, so it is best interpreted alongside the rest of the serum and urine pattern.
Populations where interpretation is most difficult
Older adults may have reduced thirst response, reduced renal concentrating ability, and greater baseline variability in urea and creatinine. In this group, single bedside signs and single urine measures perform less well as markers of dehydration. (8)
Infants and children can shift fluid status quickly, and reference ranges vary by age. Urine concentration measures are also limited in this population. BUN alone and urine specific gravity have limited sensitivity and specificity for dehydration in children. (4)
Chronic kidney disease and diuretic use change the baseline. Creatinine may already be elevated, the estimated glomerular filtration rate (eGFR) may already be reduced, and renal sodium handling may not follow the expected conservation pattern. Diuretics can increase urine sodium and distort fractional-excretion indices, even when a true deficit is present.
Serum and plasma markers and what they reflect
Serum markers are easiest to read by separating tonicity from perfusion. Serum sodium and osmolality describe the water-loss axis. BUN, creatinine, the BUN-to-creatinine ratio, and hemoconcentration markers describe kidney perfusion and plasma-volume change.
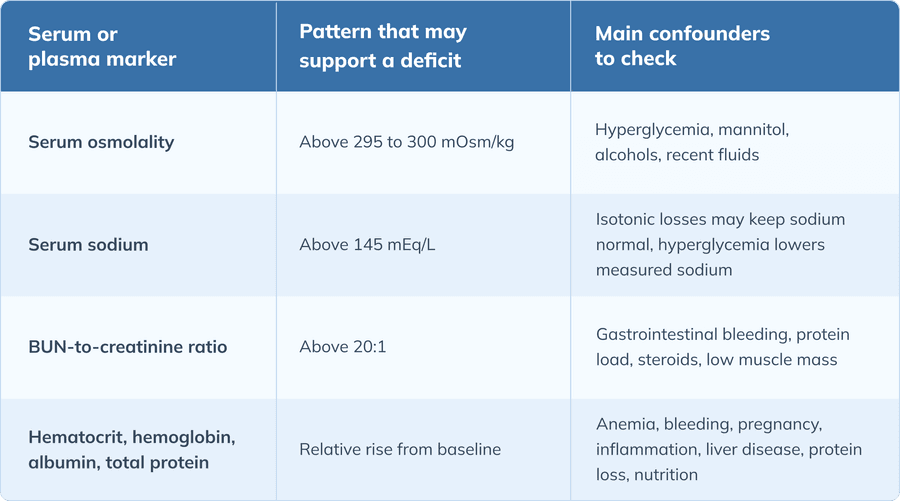
Table 1. Serum and plasma markers, patterns that may support a fluid deficit, and common confounders
Serum osmolality and the water-loss axis
Serum osmolality above 295 mOsm/kg can support the presence of a water-loss deficit. Studies in older adults have also used a cutoff near 300 mOsm/kg to identify hyperosmolar dehydration. The threshold varies by source, assay, and population, so it should be interpreted as supportive rather than diagnostic. (8)
Calculated osmolarity estimates osmolality from sodium, glucose, and urea. Measured osmolality may provide additional information when unmeasured osmoles are present or suspected. The osmolal gap, sometimes called the osmolar gap, is the difference between measured and calculated values. A widened gap can indicate unmeasured osmoles and should not be interpreted as evidence of a fluid deficit on its own.
Osmolality is most useful when the concern is free-water loss. It is less useful when sodium and water are lost together, as in many gastrointestinal or renal losses. In those cases, sodium may be normal and osmolality may be less striking despite clinically important volume depletion.
Sodium and osmolality can move in different directions. Hyperglycemia, mannitol, and other measured osmoles can raise osmolality without proving a water deficit. Alcohol or toxic alcohol ingestion can widen the osmolal gap, and a gap above 20 mOsm/kg may point toward toxic alcohols rather than a fluid deficit alone. (6) Kidney disease, diuretics, adrenal disorders, and recent fluids can also weaken the relationship between sodium, osmolality, and volume status.
Serum sodium and its directionality
Sodium above 145 mEq/L (145 mmol/L)supports a hypertonic free-water deficit in the right setting. Hypernatremia above this level is generally associated with hyperosmolality and a water deficit. (18) Common clinical settings include impaired access to water, impaired thirst, increased free-water loss, or replacement with fluid that does not match the loss.
Sodium may be high, normal, or low in hypovolemia. The direction depends on whether water loss, sodium loss, or replacement fluids predominate. Isotonic losses can leave sodium normal, and hypotonic replacement can lower sodium. A normal sodium therefore does not exclude volume depletion.
Blood urea nitrogen, creatinine, and the BUN-to-creatinine ratio
A BUN-to-creatinine ratio above 20:1 can support prerenal physiology when it occurs alongside other conserving features, such as concentrated urine and low urine sodium. Reduced perfusion increases urea reabsorption more than creatinine reabsorption, which can raise the ratio. In SI unit reporting, urea and creatinine use different units, so local unit conventions should be confirmed before applying a ratio. (16)
Creatinine and eGFR describe kidney filtration, but they are best interpreted relative to a baseline. A creatinine rise with an eGFR decline can occur with reduced perfusion, intrinsic kidney injury, obstruction, medication effects, or chronic kidney disease. A single creatinine value does not establish where the patient falls on that spectrum.
The ratio is a supportive finding with many confounders. Gastrointestinal bleeding, high protein intake, corticosteroids, catabolism, and primary kidney disease can raise urea. Low muscle mass can lower creatinine and inflate the ratio. Evidence that the ratio reliably distinguishes prerenal azotemia from tubular injury is limited, so it is most useful when the rest of the clinical and laboratory data point in the same direction. (16)
Hemoconcentration markers
Hemoconcentration refers to a relative rise in blood components as plasma volume contracts. Hematocrit, hemoglobin, albumin, and total protein may rise when plasma volume falls, making them supportive markers of volume contraction.
These markers depend heavily on the patient’s baseline values. Mild volume deficits may produce little change. Anemia, bleeding, pregnancy, inflammation, liver disease, protein loss, and nutritional status can all change the interpretation. A relative rise from the patient's prior values is often more informative than a single value.
Plasma-volume tracking is best validated in specific clinical contexts, including decongestion in heart failure. In that literature, hemoconcentration during decongestion reflects effective fluid removal. (15) That does not make hemoconcentration a standalone test for dehydration in general outpatient settings.
Urine studies in suspected hypovolemia
Urine markers show the kidney's current handling of water and sodium. They are most informative when tubular function is intact and the patient has not recently received intravenous fluids or diuretics.
Urine specific gravity and urine osmolality
Urine specific gravity (SG) above 1.020 suggests concentrated urine. Urine osmolality often rises above 500 mOsm/kg during active water conservation. Both values describe urine concentration at the time of testing and should not be interpreted as diagnostic on their own. (7)
Specific gravity is affected by solutes that osmolality handles more directly. Glucose, radiographic contrast, and protein can raise the specific gravity reading, so specific gravity can overstate concentration when those solutes are present. (7)(20) Urine osmolality is often more informative when the urine dipstick or clinical context suggests these confounders.
Low or inappropriately normal urine osmolality has different implications. In a patient expected to conserve water, it can suggest diabetes insipidus, excess water intake, tubular dysfunction, acute tubular injury, or chronic kidney disease with impaired concentrating ability.
Urine concentration measures are limited as standalone markers, especially in older adults and children. They carry more value when read with serum sodium, serum osmolality, creatinine, BUN, and the clinical setting. (8)
Urine sodium and fractional excretion
A urine sodium below 20 mEq/L can support prerenal physiology when sodium conservation is intact. Low urine sodium reflects avid sodium reabsorption and can help distinguish prerenal physiology from tubular injury or salt wasting. (6)
Fractional excretion estimates the percentage of a filtered substance that is excreted in the urine. Fractional excretion of sodium (FENa) below 1% can support a prerenal state in selected cases. Fractional excretion of urea (FEUrea) may be more useful when the patient is on diuretics, because diuretics raise urine sodium directly. (6)
Diuretics, kidney disease, adrenal disorders, metabolic alkalosis, and recent intravenous fluids can all distort urine sodium and fractional-excretion results. A low urine sodium may be absent even when true volume depletion is present . (6)
Urine color and point-of-care limitations
Urine color and dipstick findings have limited value by themselves. Diet, medications, vitamins, bilirubin, hematuria, infection, and urine concentration all change appearance. Point-of-care interpretation is best combined with serum context when determining fluid status, rather than used in isolation. (7)
Distinguishing dehydration, volume depletion, and intrinsic kidney injury
A rising creatinine may reflect reduced perfusion that improves with correction of the underlying state, or it may reflect intrinsic kidney injury. The distinction affects fluid strategy, monitoring, and referral.
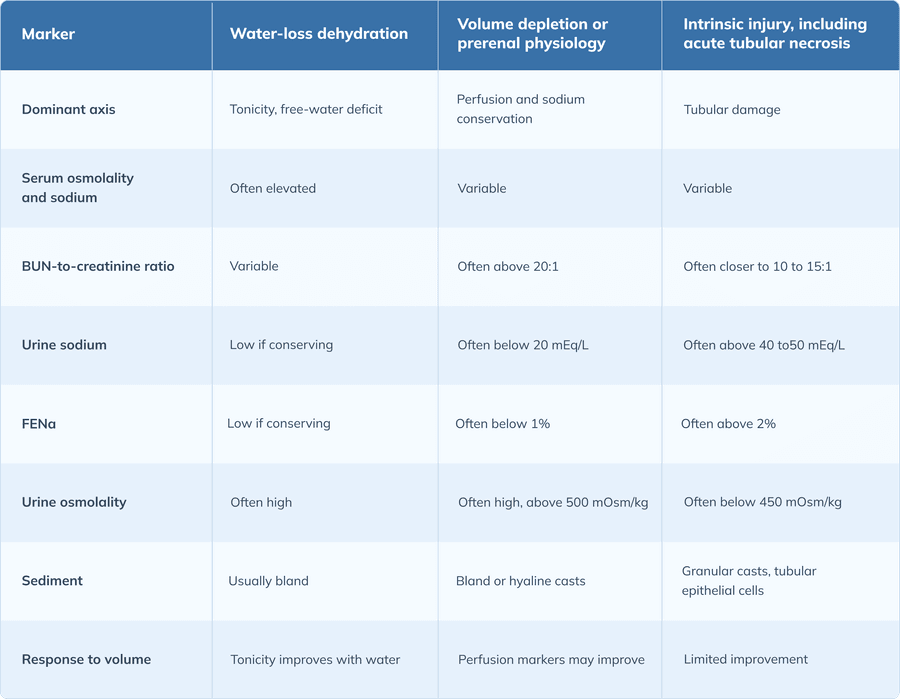
Table 2. Laboratory patterns in water-loss dehydration, volume depletion or prerenal physiology, and intrinsic kidney injury
Prerenal volume depletion versus acute tubular necrosis
A concordant prerenal pattern includes an elevated BUN-to-creatinine ratio, concentrated urine, low urine sodium, high urine osmolality, and bland sediment or hyaline casts when microscopy is available. (6)
Acute tubular necrosis (ATN) is typically associated with changes in the urine pattern. The BUN-to-creatinine ratio may fall toward 10 to 15:1, urine sodium rises, urine osmolality approaches serum osmolality, and sediment may show granular casts and renal tubular epithelial cells. (6) Intermediate patterns are common because prerenal physiology can evolve into tubular injury.
Response after appropriate volume restoration may help distinguish prerenal physiology from established tubular injury. When volume depletion is the main cause and the kidneys remain responsive, markers of perfusion and function usually improve after repletion. In heart failure, established kidney failure, or high risk of volume overload, fluids can be harmful, so careful reassessment over a short interval may be preferable when the cause is uncertain.
Some creatinine elevations warrant an evaluation for intrinsic kidney injury. Persistent elevation after volume correction, oliguria, active sediment with hematuria, proteinuria, or casts, nephrotoxin or contrast exposure, rhabdomyolysis with creatine kinase (CK) above 1000 IU/L, obstruction, and severe infection all shift the differential beyond a simple fluid deficit. (5)
Low effective arterial blood volume without total-body water loss
Heart failure, cirrhosis, nephrotic syndrome, and distributive physiology can reduce effective arterial blood volume despite normal or expanded total-body water. In cirrhosis, splanchnic vasodilation and arterial underfilling can produce a prerenal pattern without true water loss. (12)
In these settings, the term dehydration can be misleading. The patient may be fluid-overloaded while the kidneys respond as if perfusion is low, so fluids given on the assumption of a simple deficit can worsen volume overload. (12) The same prerenal laboratory pattern may require different management depending on the underlying physiology.
Differentiating acute change from chronic kidney disease
Baseline creatinine, eGFR, prior laboratory values, and imaging findings may help distinguish chronic kidney disease from an acute change. Small, echogenic kidneys on imaging support chronicity. A single creatinine value generally cannot distinguish an acute rise from a chronic baseline. (10)
Acute-on-chronic presentations are common. A patient with chronic kidney disease can develop superimposed hypoperfusion, tubular injury, obstruction, or medication-related injury. When baseline values are already abnormal, the acute kidney injury definition helps identify a new acute change: a serum creatinine rise of at least 0.3 mg/dL within 48 hours, a rise to at least 1.5 times baseline within 7 days, or urine output below 0.5 mL/kg/h for 6 hours. (10)
Combining serum and urine patterns into a working interpretation
A working interpretation integrates tonicity and perfusion findings. Sodium and osmolality are typically used to describe the water-loss axis. BUN, creatinine, urine sodium, fractional excretion, urine osmolality, and sediment are typically used to describe perfusion and tubular response. Mixed clinical and laboratory patterns are common.
A concordant prerenal pattern in an appropriately assessed, responsive patient may support cautious volume repletion, though urinary indices such as FENa lose reliability in patients with CKD, diuretic use, or other confounders and should not be interpreted in isolation. An ATN pattern, active sediment, low effective arterial blood volume, or high risk of overload changes the fluid strategy and may require closer monitoring or referral. Borderline or confounded results often warrant repeat testing and comparison with baseline values before they guide major clinical decisions. (1)
Common laboratory mimics and misleading patterns
Several findings can resemble a fluid deficit without proving one. These mimics can change fluid decisions or point to another diagnosis.
Elevated blood urea nitrogen unrelated to hypovolemia
Gastrointestinal bleeding, high protein intake, and catabolism can raise urea through increased nitrogen load. Digested blood in the gastrointestinal tract raises BUN, so a high BUN-to-creatinine ratio can accompany upper gastrointestinal bleeding and resemble a prerenal pattern. (19)
Corticosteroids and primary kidney disease can also raise urea independent of volume status. Low muscle mass can lower creatinine and increase the BUN-to-creatinine ratio because of a lower creatinine denominator. The ratio should be interpreted alongside urine sodium, urine osmolality, kidney function, rather than in isolation. (16)
Misleading urine concentration and sodium results
Glucosuria, contrast, and proteinuria can raise specific gravity through dissolved solutes that increase urine density. In those cases, the urine may appear concentrated by SG even when true concentration is less clear, and urine osmolality may clarify the discrepancy. (7)
Diuretics, kidney disease, and adrenal disorders may raise urine sodium despite a true volume deficit. This may eliminate the expected low urine sodium associated with sodium conservation and reduces the utility of spot urine sodium as a standalone marker. (6)
The syndrome of inappropriate antidiuretic hormone secretion (SIADH) produces antidiuresis with concentrated urine, low serum sodium, and clinical euvolemia. That combination can resemble a conserving response, but the underlying pathophysiology is different. Euvolemia, serum sodium, and the overall clinical context should be considered before concentrated urine is attributed to volume depletion. (13)
Sodium and osmolality pitfalls
Hyperglycemia lowers measured sodium and raises measured osmolality. Common correction formulas add 1.6 mEq/L to sodium for every 100 mg/dL of glucose above normal, although larger correction factors (approximately 2.4 mEq/L) have been reported to better estimate sodium at very high glucose levels. (9) Lipids and proteins can also distort reported sodium through pseudohyponatremia, depending on the laboratory assay.
Fixed thresholds are less reliable across older adults, children, patients with chronic kidney disease, and patients receiving recent fluids or diuretics. Trend, baseline, and clinical context often provide more information than a single cutoff. (8)
Recognizing when severity warrants escalation rather than outpatient testing
Severe symptoms or high-risk laboratory findings may warrant urgent evaluation before the fluid pattern is fully characterized.
Clinical red flags that outweigh laboratory confirmation
Altered mental status, syncope, and severe weakness can reflect dangerous changes in perfusion or tonicity. Inability to tolerate oral intake and very low urine output also make outpatient repletion less reliable. Hypotension and signs of shock are key warning features, since shock is a state of global tissue hypoperfusion that requires resuscitation rather than observation. (14)
Laboratory red flags that demand urgent evaluation
Marked sodium abnormality, rapidly rising creatinine, severe acid-base disturbance, and clinically important potassium abnormalities warrant urgent evaluation rather than serial outpatient monitoring. (10)
Some patterns suggest a metabolic emergency rather than uncomplicated volume loss. Diabetic ketoacidosis (DKA), hyperosmolar hyperglycemic state (HHS), sepsis, adrenal crisis, and rhabdomyolysis can all present with dehydration-like features. The diagnostic criteria for DKA and HHS define one branch of this differential. (17) Sepsis can present as distributive shock with hyperlactatemia. (14) Adrenal crisis may present with hyponatremia, hyperkalemia, and hypotension. (2) Rhabdomyolysis is associated with CK above 1000 IU/L and myoglobinuria. (5)
Consequences of severe hypertonic or hypovolemic states
Sustained hypoperfusion can progress to acute kidney injury and hemodynamic instability. The acute kidney injury staging criteria are designed to detect clinically important change early. (10)
Severe hypernatremia and rapid sodium shifts can affect neurologic function. Both hypernatremia and overly rapid correction have traditionally been associated with neurologic risk, so the rate of correction is part of the safety assessment. (18)
When workup supports care versus when it delays it
Laboratory data are useful when the patient is clinically stable enough to wait and the results are expected to change the next management step. For example, serum and urine patterns may help distinguish prerenal physiology from tubular injury before fluid management is continued.
In a patient with signs of shock, continued outpatient testing can delay needed escalation. (14) In that setting, urgent evaluation and stabilization take priority over refining the laboratory pattern.
Selecting and sequencing laboratory studies in practice
Test selection depends on the clinical question. A small group of serum and urine studies can clarify tonicity, kidney perfusion, tubular response, and possible mimics when read against baseline values.
Core serum panels
A basic metabolic panel provides sodium, potassium, BUN, creatinine, glucose, and bicarbonate. A comprehensive metabolic panel adds liver tests along with albumin and total protein, which can provide additional context regarding hemoconcentration. Serum osmolality and a complete blood count (CBC) may be added when tonicity or plasma-volume change is part of the assessment. Calculated and measured osmolality have been compared in studies of older adults to support the water-loss assessment. (8)
Glucose belongs in the osmotic assessment because hyperglycemia raises measured osmolality and changes corrected sodium. Severe hyperglycemia also raises concern for HHS in the right clinical setting. (17)
Urine studies
Urinalysis, urine osmolality, and urine sodium help assess urine concentration and renal sodium handling. They are most useful when interpreted with serum sodium, serum osmolality, BUN, creatinine, and the medication history.
When spot urine values are ambiguous or diuretic exposure is present, fractional excretion of sodium and urea can provide additional information. FEUrea has traditionally been preferred during diuretic exposure because diuretics directly raise urine sodium, though recent meta-analyses suggest its diagnostic advantage over FENa in this setting is less certain than originally reported. (6)
Interpreting results against baseline and trajectory
Prior results and serial testing often clarify whether a value is new, chronic, improving, or worsening. Creatinine, sodium, hematocrit, albumin, and urine findings are more informative when compared with the patient's baseline.
A trajectory across two or three draws can distinguish an acute change from baseline variation more reliably than a single value. The same principle applies after fluids, medication changes, or recovery from an acute illness. (10)
Documenting and communicating dehydration lab findings
Documentation should show the pattern, the clinical context, and the level of certainty. This reduces the chance that one abnormal value becomes an unsupported dehydration label in the chart.
Pattern-based reporting versus single-value labeling
Concordant serum and urine findings can be described as supporting a fluid deficit or as being consistent with prerenal physiology. The underlying physiology is a pattern across several markers, not one cutoff. (1)
Discordant or confounded results should be flagged directly. A high BUN-to-creatinine ratio with possible gastrointestinal bleeding, concentrated urine with glucosuria, or low sodium with concentrated urine in an euvolemic patient points toward a broader differential rather than a simple dehydration label.
Documentation-ready interpretation language
Careful phrasing helps the record reflect the strength of the evidence. Wording such as suggests, supports, is consistent with, and requires clinical correlation fits most laboratory patterns in suspected dehydration.
Categorical phrasing may overstate what the data can show. Avoid documenting that one value proves dehydration, rules out dehydration, or confirms dehydration by itself. No single laboratory value supports that level of certainty. (1)
Frequently asked questions (FAQs)
Which serum value most objectively supports water-loss dehydration when bedside assessment is equivocal?
Serum osmolality is one of the most objective single serum markers of a hypertonic, water-loss deficit, with values often above 295 to 300 mOsm/kg supporting this interpretation. It is generally more useful for free-water loss than for combined salt-and-water depletion. (8)
How should an elevated BUN-to-creatinine ratio be weighted when gastrointestinal bleeding, a high protein load, or corticosteroid use is also present?
An elevated ratio should be weighted cautiously because gastrointestinal bleeding, high protein intake, catabolism, corticosteroids, and low muscle mass may change the ratio independent of volume status. (19) It is more supportive when urine sodium, urine osmolality, creatinine trend, and the clinical picture also suggest reduced perfusion. (16)
How reliable is urine specific gravity for assessing a fluid deficit, and when does urine osmolality add more?
Urine specific gravity above 1.020 suggests concentrated urine, but glucose, contrast, and protein can raise the reading. Urine osmolality adds more when those solutes are present or when SG does not fit the serum findings. (7)
In a patient on chronic diuretics, how reliable is urine sodium for identifying volume depletion?
Urine sodium is less reliable during diuretic exposure because diuretics raise urine sodium directly. A normal or high urine sodium therefore does not by itself exclude volume depletion, and FEUrea may be more useful in this setting. (6)
How does hyperglycemia alter the interpretation of serum sodium and measured osmolality?
Hyperglycemia lowers measured sodium and raises measured osmolality. Corrected sodium may be estimated by adding roughly 1.6 mEq/L for every 100 mg/dL of glucose above normal, with a larger correction near 2.4 mEq/L sometimes used at very high glucose levels. (9)
What urine and serum findings help separate evolving prerenal azotemia from established acute tubular necrosis?
Prerenal physiology may be supported by a BUN-to-creatinine ratio above 20:1, urine sodium below 20 mEq/L, FENa below 1%, high urine osmolality, and bland sediment. Acute tubular necrosis may be supported by a lower ratio, higher urine sodium, FENa above 2%, urine osmolality closer to serum, and granular casts or tubular epithelial cells. (6)
When does an elevated creatinine warrant working up intrinsic kidney injury rather than attributing it to a fluid deficit?
Intrinsic kidney injury becomes more likely when creatinine remains elevated after volume correction, oliguria persists, active sediment is present, or the history includes nephrotoxin exposure, contrast exposure, rhabdomyolysis risk, obstruction, or severe infection. (5)(10) These features should shift the evaluation beyond a simple fluid deficit.
When do hematocrit and albumin changes meaningfully indicate hemoconcentration rather than baseline variation?
Hematocrit and albumin are most useful when they rise relative to the patient's prior values and when confounders such as anemia, bleeding, pregnancy, inflammation, liver disease, protein loss, and nutrition status are considered. The strongest validation for plasma-volume tracking comes from heart-failure decongestion literature, not from general outpatient dehydration assessment. (15)
Which laboratory thresholds are least reliable in older adults compared with younger patients?
Single bedside signs and single urine measures, including urine specific gravity and urine osmolality, are less reliable in older adults because of reduced concentrating ability and baseline variability. Serum osmolality is generally a more dependable marker for water-loss dehydration in this population. (8)
At what point should clinical red flags or high-risk laboratory findings override further outpatient testing and prompt escalation?
Altered mental status, syncope, hypotension or shock, inability to tolerate intake, very low urine output, marked sodium abnormality, rapidly rising creatinine, dangerous potassium abnormality, or severe acid-base disturbance should prompt urgent evaluation. (10)(14) These findings can make additional outpatient testing unsafe or too slow.
The bottom line
Fluid deficits show up as patterns, not as single diagnostic values. Serum sodium and osmolality help describe tonicity. BUN, creatinine, urine sodium, urine osmolality, and urine sediment help describe perfusion and kidney response. Hemoconcentration markers and prior results add context when baseline values are available.
Several common findings can mimic dehydration. Gastrointestinal bleeding, high protein intake, corticosteroids, low muscle mass, glucosuria, contrast, proteinuria, diuretics, kidney disease, adrenal disease, SIADH, hyperglycemia, and pseudohyponatremia can all change blood or urine results in ways that resemble a fluid deficit.
Interpretation is strongest when it is pattern-based and interpreted in clinical context. Concordant findings can support water-loss dehydration, extracellular volume depletion, or prerenal physiology. Discordant, severe, or persistent findings should broaden the differential to intrinsic kidney injury, low effective arterial blood volume, endocrine disease, metabolic emergency, infection, obstruction, or another cause that requires closer evaluation. In the record, these patterns are best described as supportive rather than confirmatory.
Current nephrology and clinical-chemistry references, interpreted alongside the history and physical examination, support this approach to interpreting lab findings in suspected dehydration. Clinical and laboratory red flags mark when severity, rather than further outpatient testing, should drive escalation.
Ready to start delivering better patient care?
Join 125,000 healthcare providers who rely on Fullscript to dispense top-quality supplements and labs to their patients.